Processing is a java language base scripting tool that allows the creative users to represent information in a graphical or dynamic way. In the context of mapping and cartography, processing allows the user to make mapping more dynamic and explore beyond the information of a static provides. Furthermore, the dynamism of processing allows the user to explore the limitations of the data provided by the cartography, but also allow the discovery of new information.
Dynamic Cartography
Cartography is conventionally a static map that refrains from movement, but a capture of the mapping in a specific instant. Cartography remains the constant tool of consistency, but does not change with the information provided. As information updates and new data is provided, digital cartography becomes import to represent the datascapes in a dynamic manner. Cartographic maps must provide the breadth of data to clearly represent the constant changing data with a dynamic movement.
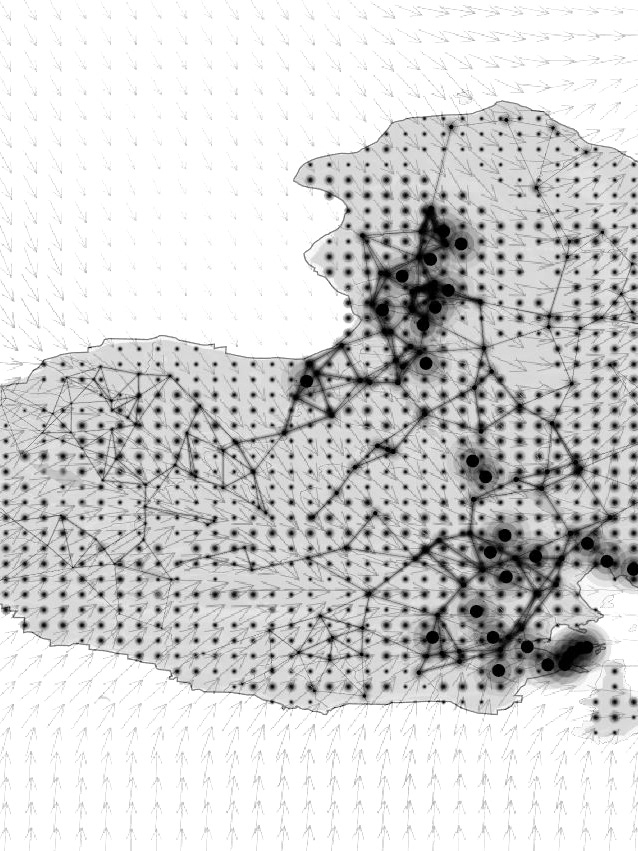
Dynamic movements include agent base movements in scripting. Scripting in processing unlocks the capabilities of mapping to become dynamic. In the series of steps to capture the dynamism in cartography, mapping is captured in ArcGIS to allow the base work of mapping to occur. Many of the ArcGIS files are unprocessed and raw for the visualisation. The data must then be import into a container and initialised to allow the maps to be activated. Once the maps are running in processing, functions can be added to process to activate the maps with agent movements or mouse clicks to unveil more information regarding the maps.
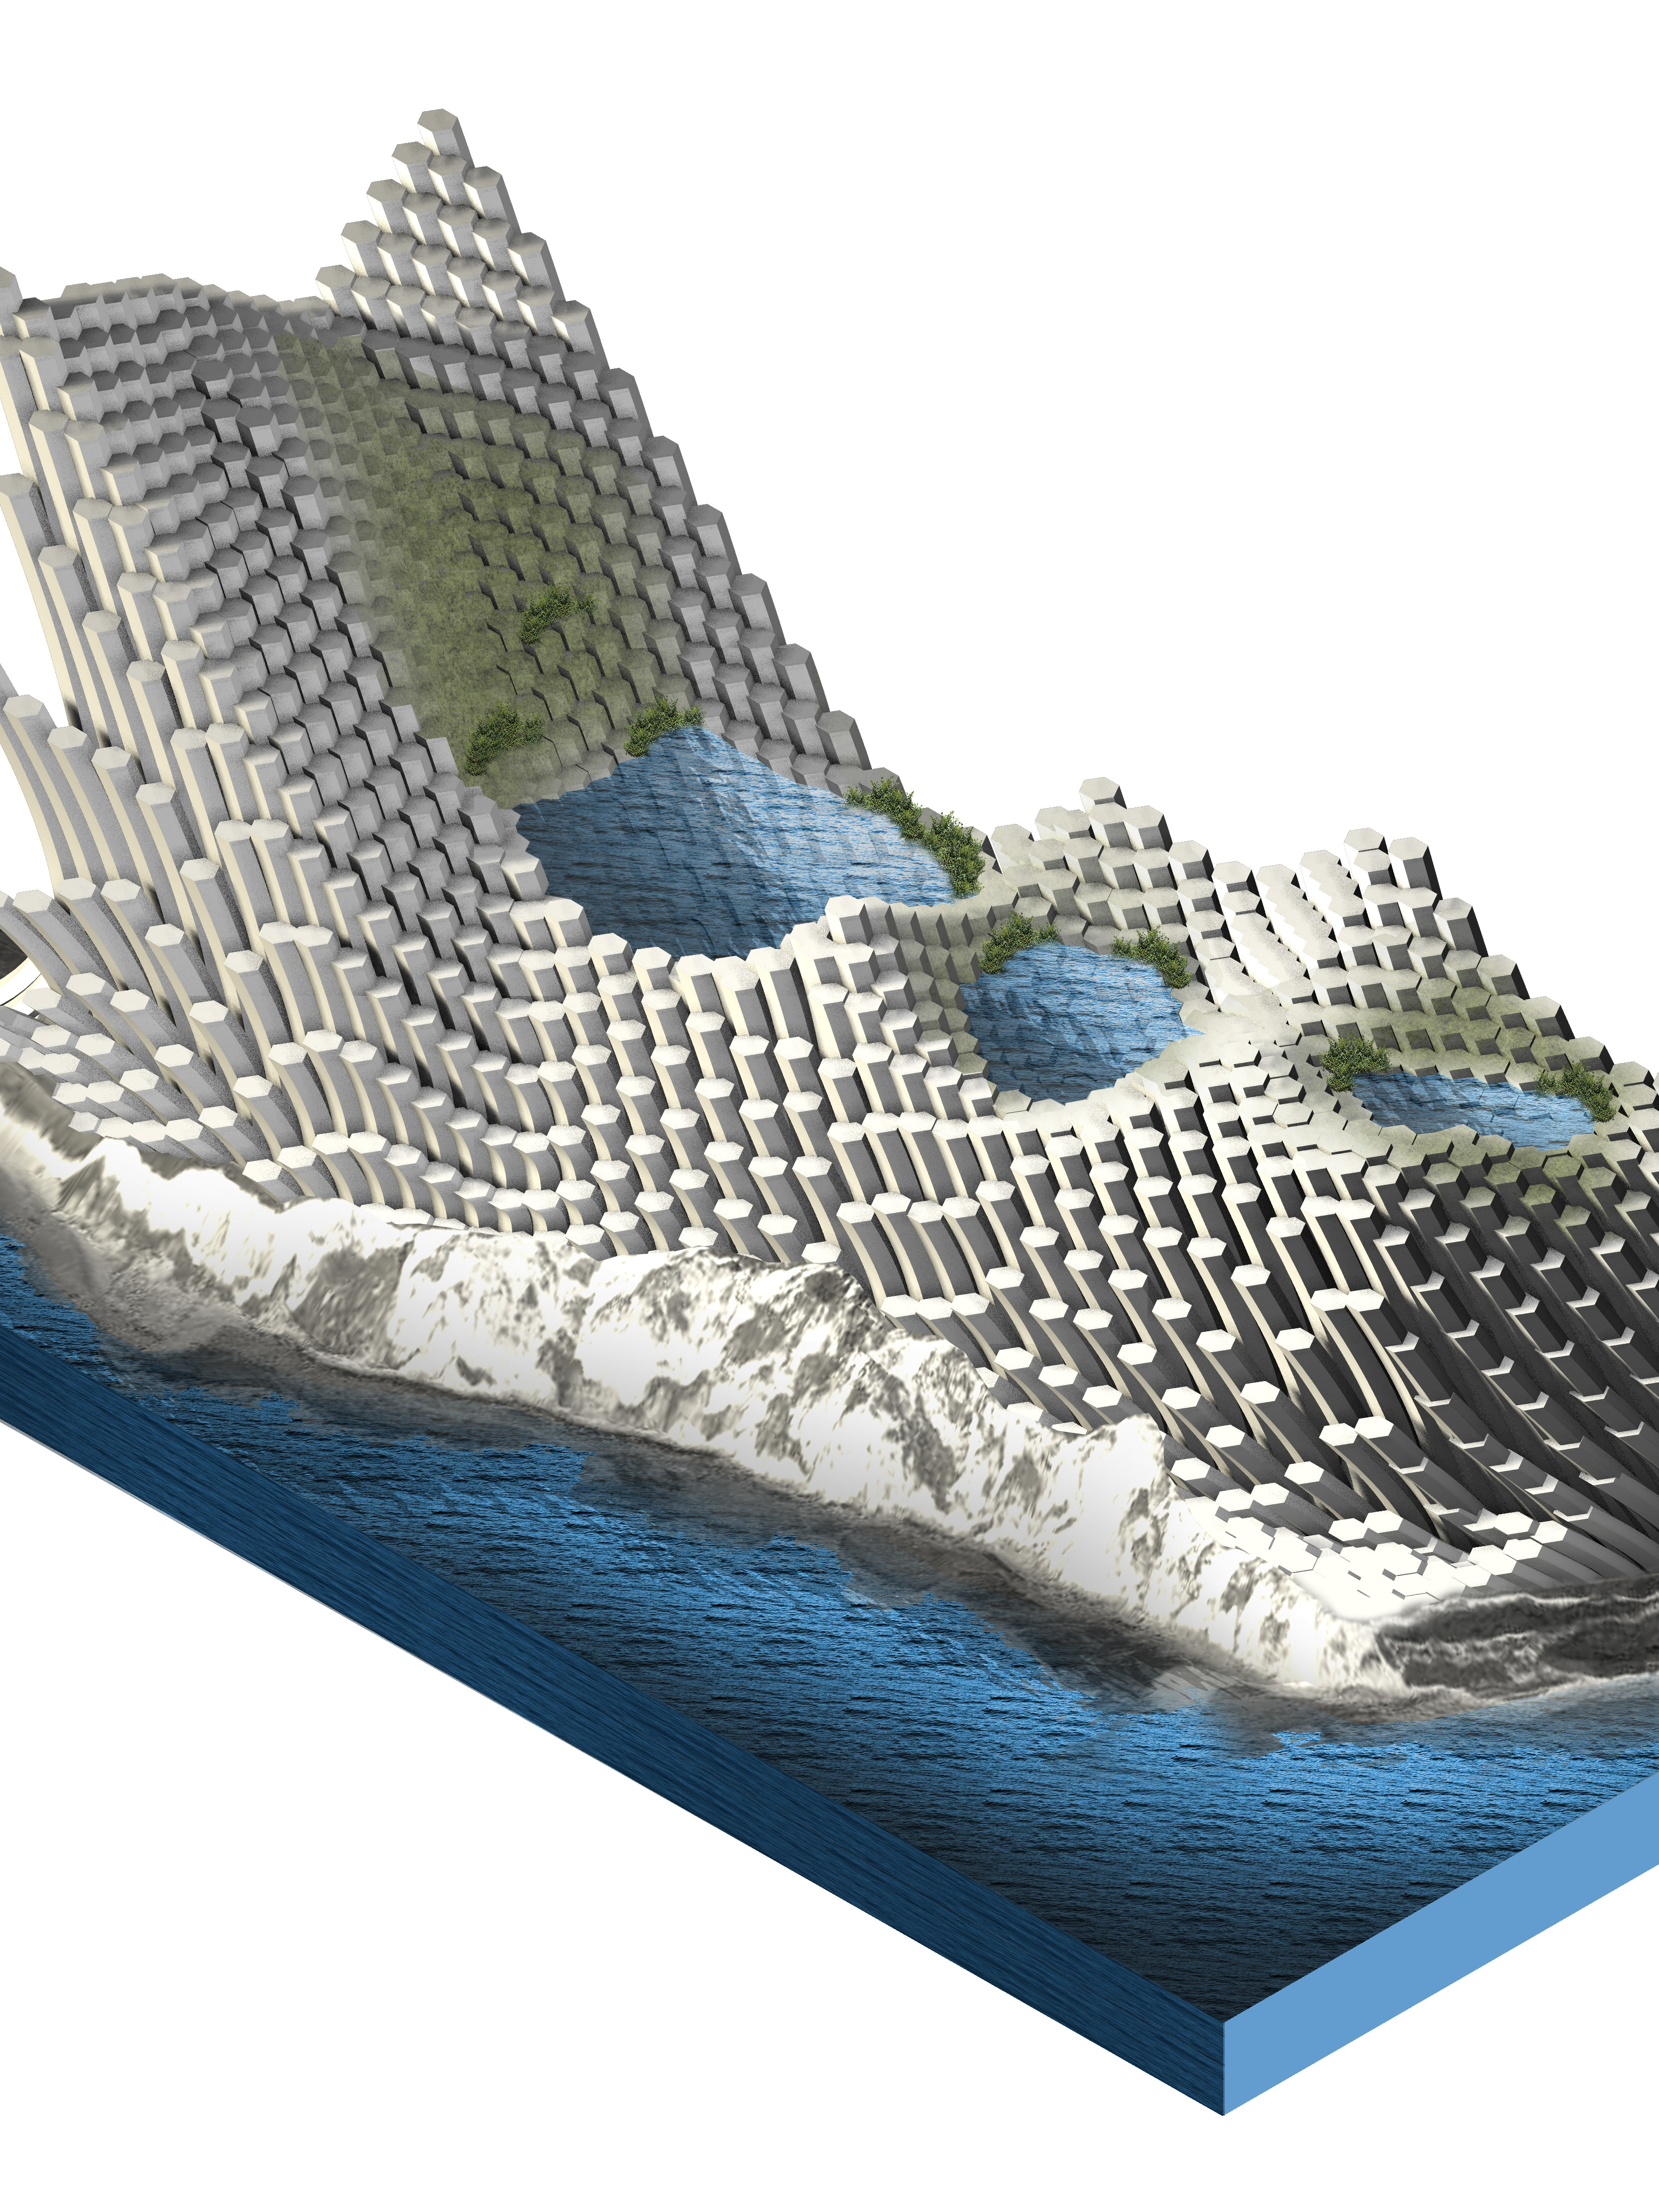
Dynamism is added for the Isle of Eigg to unveil a graphic representation. The analysis of the solarscapes are revealing the dynamic potential solar energy production. The maximum solar radiation of the island shows cases the high potentials of solar energy, which are exhibited in the south side of the island. This analysis provides the instant understanding information generated. Graphically, dynamic cartography is providing a stronger case of representing the datascapes to better inform the user and design decision.
Dynamic movements include agent base movements in scripting. Scripting in processing unlocks the capabilities of mapping to become dynamic. In the series of steps to capture the dynamism in cartography, mapping is captured in ArcGIS to allow the base work of mapping to occur. Many of the ArcGIS files are unprocessed and raw for the visualisation. The data must then be import into a container and initialised to allow the maps to be activated. Once the maps are running in processing, functions can be added to process to activate the maps with agent movements or mouse clicks to unveil more information regarding the maps.
Dynamism is added for the Isle of Eigg to unveil a graphic representation. The analysis of the solarscapes are revealing the dynamic potential solar energy production. The maximum solar radiation of the island shows cases the high potentials of solar energy, which are exhibited in the south side of the island. This analysis provides the instant understanding information generated. Graphically, dynamic cartography is providing a stronger case of representing the datascapes to better inform the user and design decision.
Graphical User Interface
While investing the solarscapes Isle of Eigg, the maximum projected energy resources of the island indicates that the solar energy resources do no provide a full production to meet the consumption rate of the island. The challenge of providing renewable energies does not satisfy the full demands of the island, which indicates the need for other energy resources on the island to compliment each other. The analysis provided the realisation of lack of energy resources.
Aside from the analysis, processing provides many control over the dynamic mapping. Control over the mapping includes adding buttons from mapthing to toggle functions of the map. In addition, adding key buttons can allow the toggle of functions as well. To make the maps with evident movement, functions would have to be added to utilise tools such as closest points, agents, and also mouse click functionalities. As seen in processing interface, it is good practice to provide organised workflows to allow ease of readibility and use.
Aside from the analysis, processing provides many control over the dynamic mapping. Control over the mapping includes adding buttons from mapthing to toggle functions of the map. In addition, adding key buttons can allow the toggle of functions as well. To make the maps with evident movement, functions would have to be added to utilise tools such as closest points, agents, and also mouse click functionalities. As seen in processing interface, it is good practice to provide organised workflows to allow ease of readibility and use.
Classes and Functions
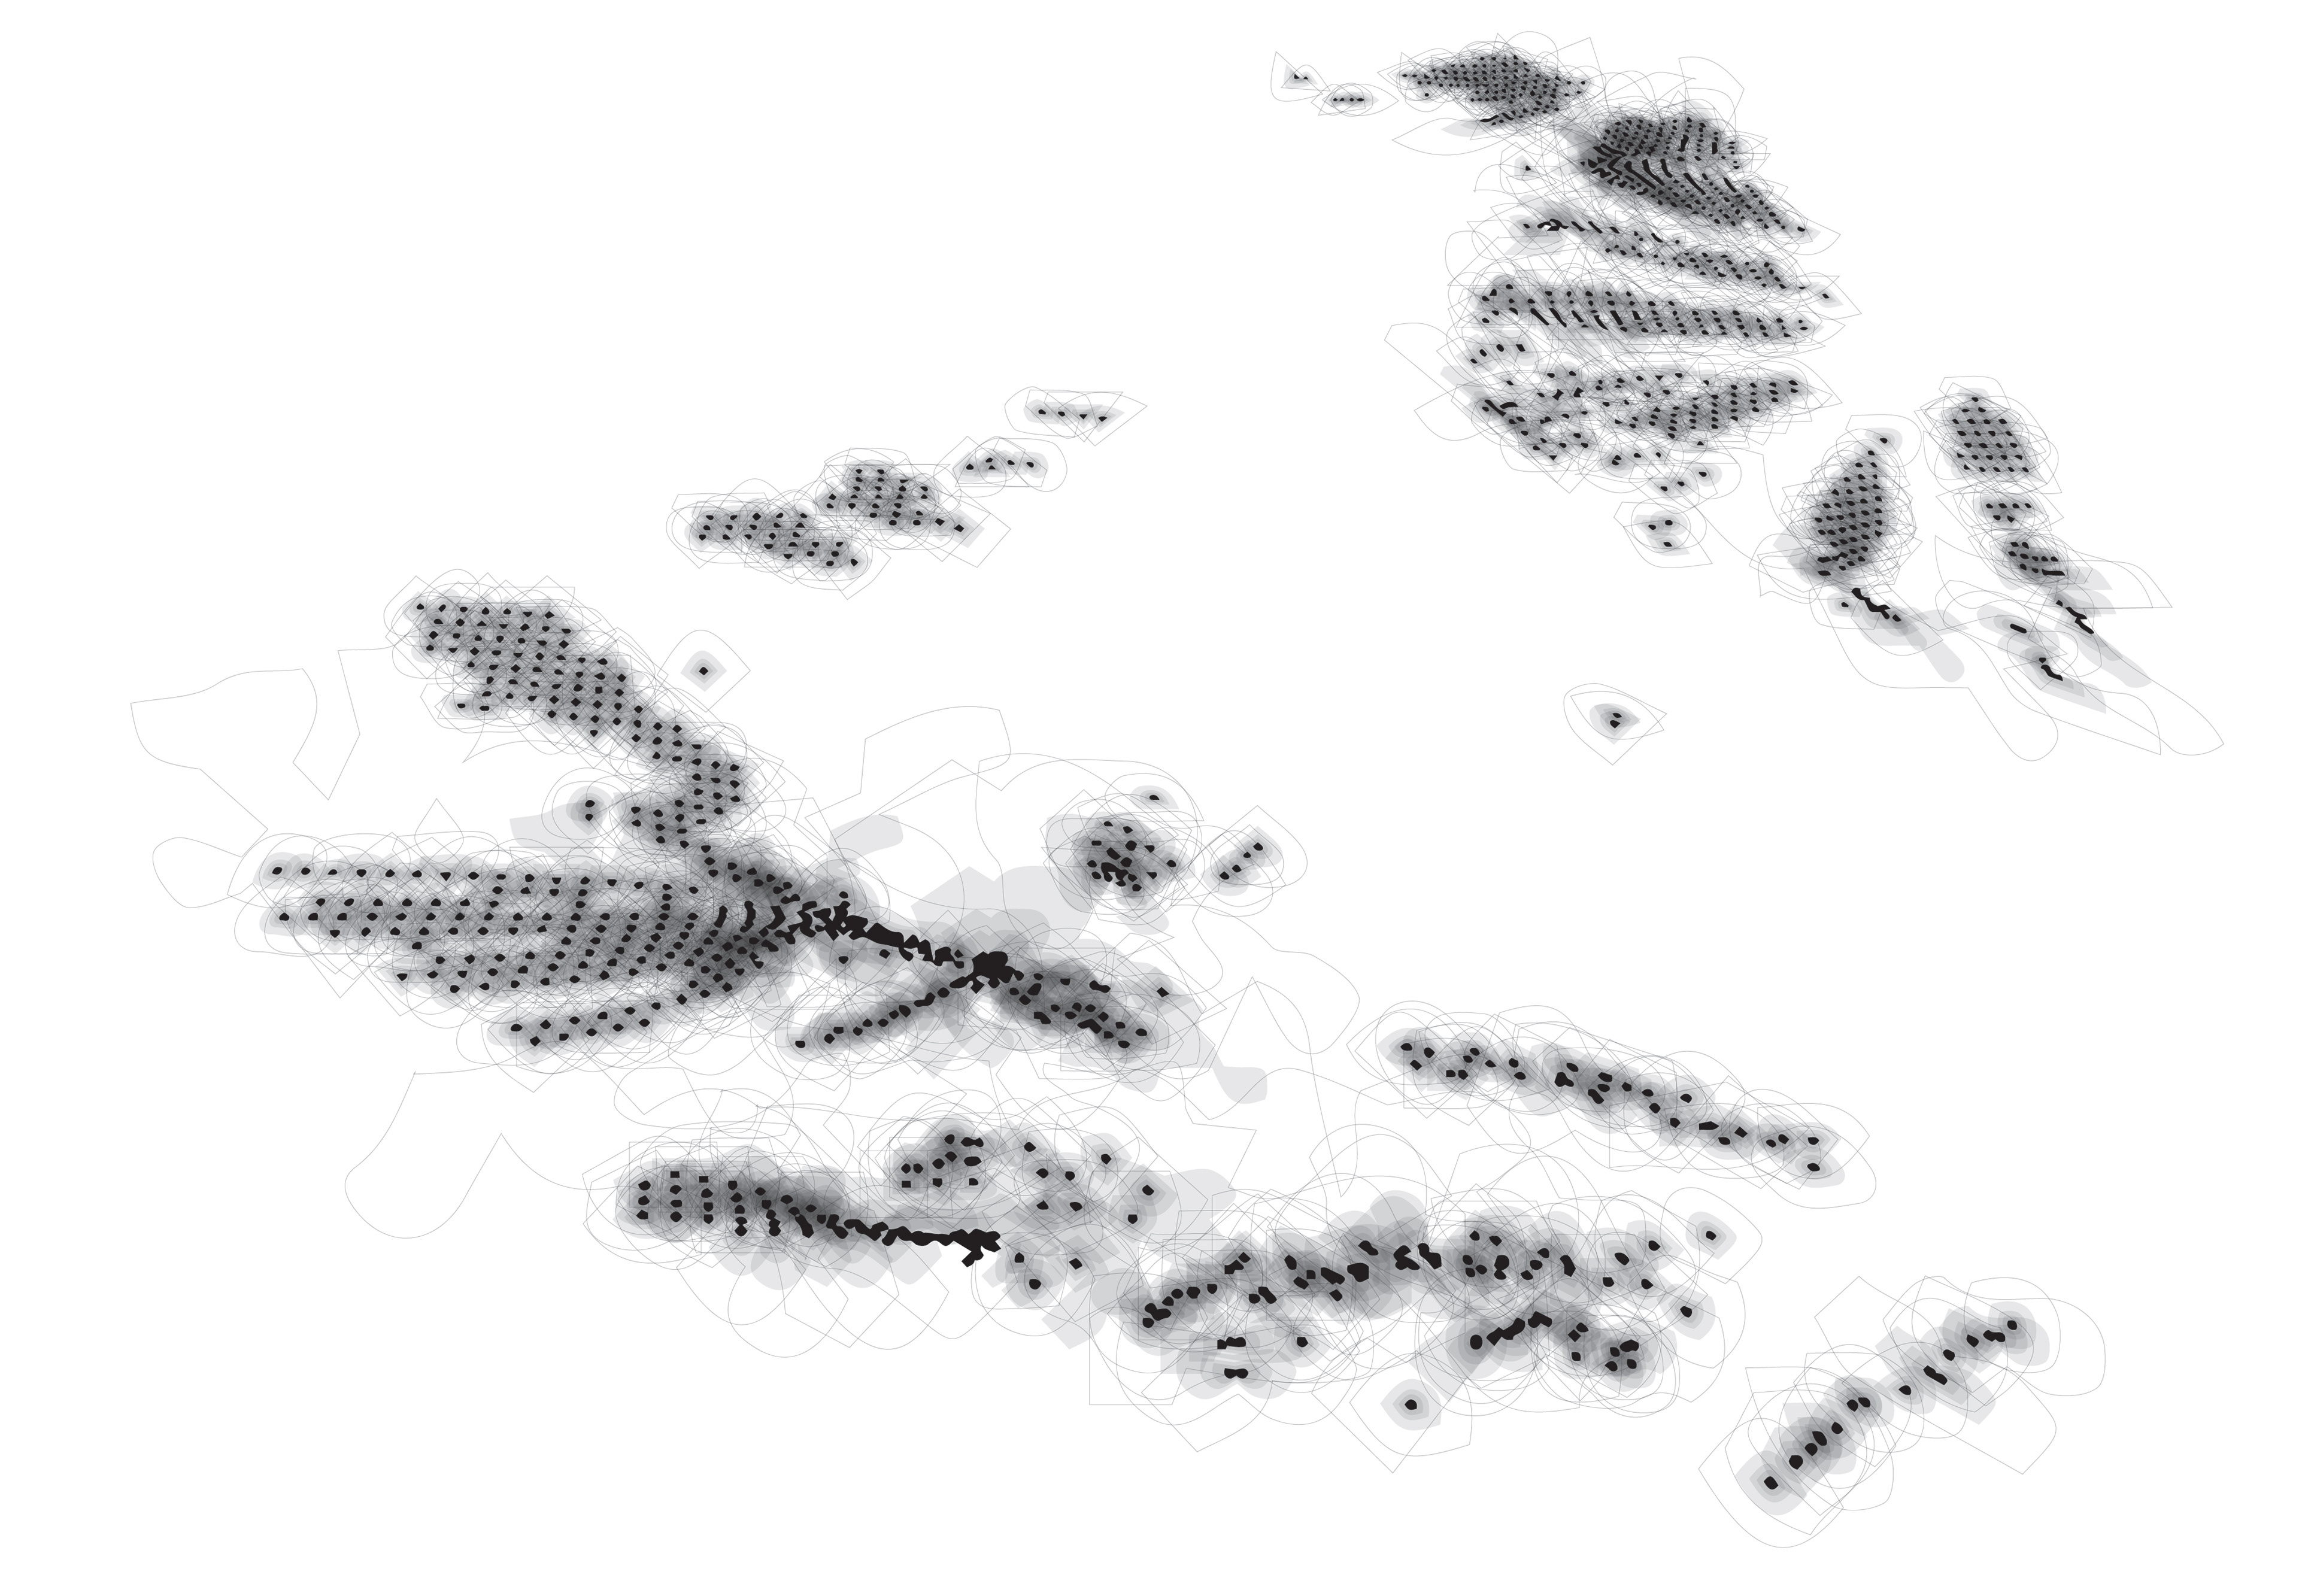
In the processing script for the solarscapes, certain functions have to be defined to activate the map. The function shown here is waterdrop, which allows agent movements to move along assigned points. The particles would then move along the network points towards the reservoir. A weight is assigned to the reservoir between the network points and the reservoir points to allow the points to be redirected.
When toggling, the second weights would then be the buildings to indicate the buildings consuming the energy resources. As the particle moves, the energy resources can be consumed instantaneously once the energy is needed to be used. Energy resources are switched between the reservoirs and buildings because reservoirs are provided as power stations for storage and the water is released to generate more energy from the dams.
When toggling, the second weights would then be the buildings to indicate the buildings consuming the energy resources. As the particle moves, the energy resources can be consumed instantaneously once the energy is needed to be used. Energy resources are switched between the reservoirs and buildings because reservoirs are provided as power stations for storage and the water is released to generate more energy from the dams.
Demise of solar energies
Solar energies are a viable renewable energy; however, solar energy would never fix the issue of replacing non-renewables and other renewables such as wind and hydro. Based on the studies shown, solar energies can offset some of the energies and contribute to the overall network. This results in a demise of solar energies and must be a complimentary asset to the existing energy production.
Through processing, visualising the dynamism of cartography allowed better informed design and understand the performative qualities energy mapping requires. Furthermore, graphical representation of flowing energies conveys a better understanding of how energies are being produced and consumed. The possibilities of utilising processing as a tool allows the user to explore the agent base movements to better inform design and the performances. This is a crucial tool to represent data to those who are not visually inclined to better understand the versatility of design. Processing is a powerful for visualising data; however, understanding the tool for mapping assists the informate design decision making. Allowing processing to be used sparingly at the given moment without having to spend majority of the time to script.
Through processing, visualising the dynamism of cartography allowed better informed design and understand the performative qualities energy mapping requires. Furthermore, graphical representation of flowing energies conveys a better understanding of how energies are being produced and consumed. The possibilities of utilising processing as a tool allows the user to explore the agent base movements to better inform design and the performances. This is a crucial tool to represent data to those who are not visually inclined to better understand the versatility of design. Processing is a powerful for visualising data; however, understanding the tool for mapping assists the informate design decision making. Allowing processing to be used sparingly at the given moment without having to spend majority of the time to script.